Every device, reading, alert and trip from iMatrix, on iOS and Android. And when a sensor has no network of its own, the app collects it directly over Bluetooth and files the history in the cloud.
The app is the field companion to the iMatrix dashboard — everything the desktop knows about your devices, plus one thing only a phone can do.
Gateways and sensors grouped by type, with live online and offline counts, favourites, and per-device history.
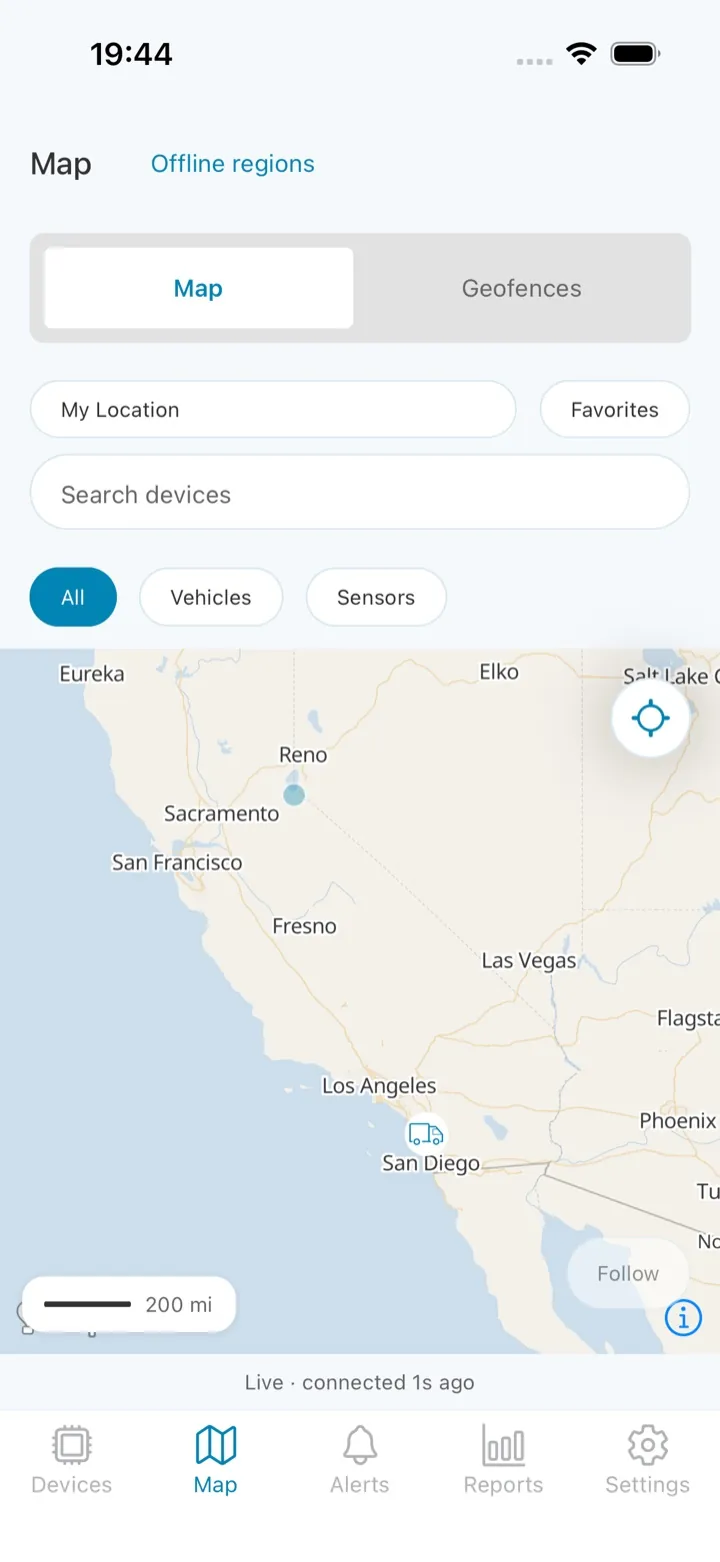
Live positions, trip playback, geofences and downloadable offline regions.
Threshold and status alerts across the fleet, filterable, and reachable from any device screen.
Fleet reporting on the same data the dashboard reports on.
Turn the phone into a Bluetooth gateway and collect from sensors with no network of their own.
Profile, security, notifications, members, SIM inventory and update control.
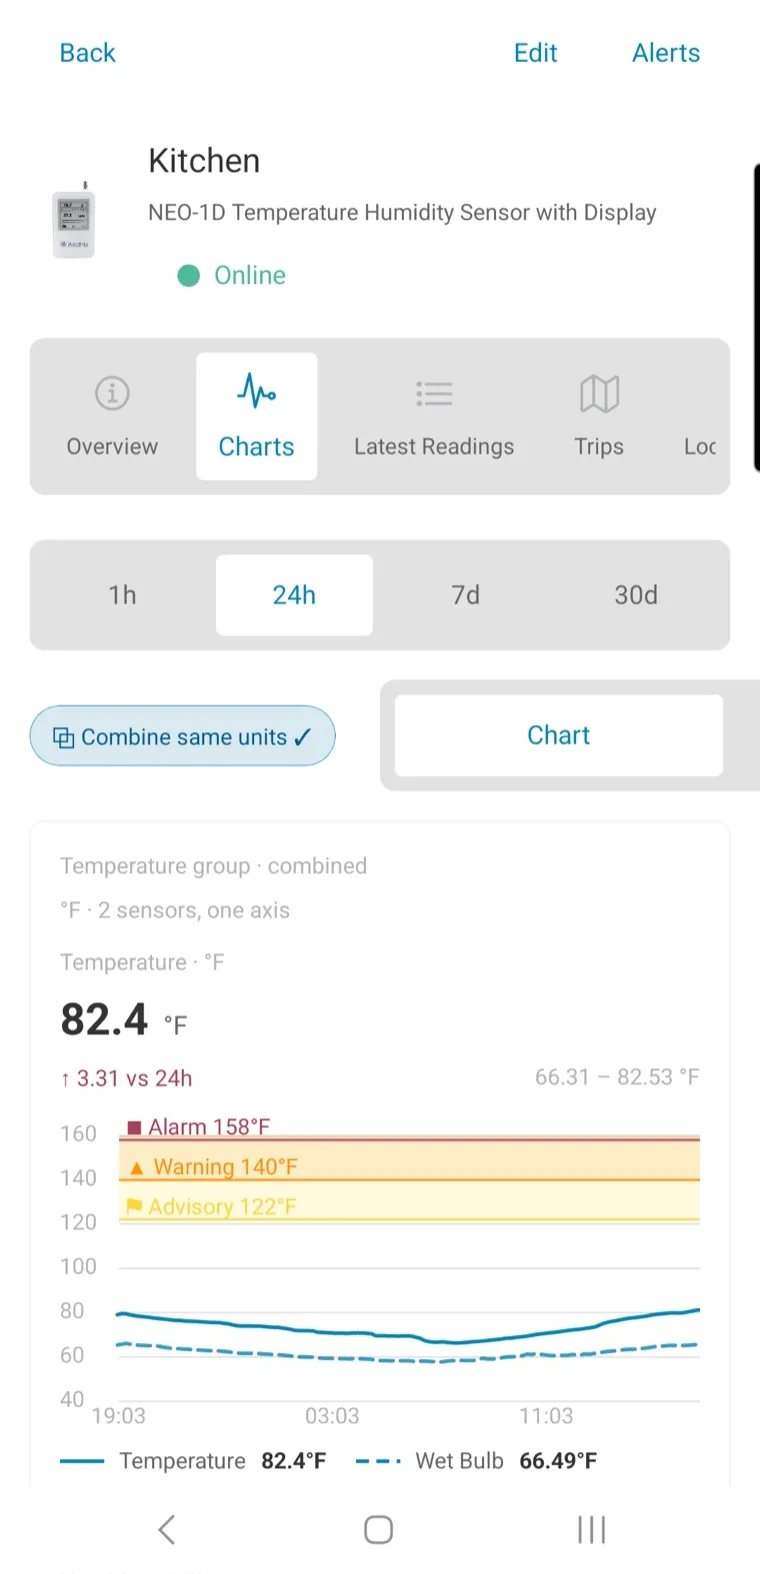
A NEO-1D reports temperature, humidity, dew point, wet bulb, heat index and VPD. The app charts them the way a temperature specialist expects — sensors sharing a unit on one axis, alarm limits drawn as bands, and the underlying numbers one tap away.
Battery-powered sensors record continuously but have no uplink. Traditionally that means a mains-powered gateway on site, one per location, forever. The app removes the requirement — the phone in your hand does it while you walk past.
Every sensor in range placed on concentric rings by received signal strength. Tap a node to open that device.
Sensors wake on their own cadence. The app shows which is due next, counts it down, and lists anything overdue.
Separate Bluetooth and cloud meters with sparklines — the read and the upload as two distinct things.
A card per collection session with per-sensor charts and any reading that fell outside its limits.
Pulls the sensor’s logged history, not just its current value, so a gap while nobody was nearby still gets filled.
Door and status sensors record events rather than samples. The app reads those too, including openings from weeks ago.
Vehicles and sensors on one live map, with a connection indicator so you always know whether what you’re looking at is current.
Collecting over Bluetooth means holding the only copy of some data for a few seconds. The app is engineered around that responsibility.
A sensor is never told to clear its memory until the cloud confirms it has the readings. If the upload fails the data stays on the device and is collected next time.
Readings are written to disk before anything else happens, so force-quitting mid-transfer costs nothing.
If the app cannot positively identify which channel a reading belongs to, it declines to upload it. A wrong value in your history is worse than a missing one.
No signal is a delay, not a failure. Readings queue on the phone and upload when connectivity returns.
Fixes arrive without an app-store round trip, with the exact release number visible in Settings.
On a tablet the Virtual Gateway splits into radar and live feed side by side; on a phone the same views are a swipe apart.
| Platforms | iOS and Android — phones and tablets, with a dedicated tablet layout |
|---|---|
| Sensor link | Bluetooth Low Energy, direct to the sensor |
| Collected data | Logged time-series history, recorded events, live advertised values, battery state |
| Temperature channels | Temperature, humidity, dew point, wet bulb, heat index, vapour-pressure deficit |
| Chart ranges | 1 hour, 24 hours, 7 days, 30 days — chart or table |
| Alert levels | Alarm, warning and advisory — high and low, each independently switchable, with dwell time |
| Units | °C or °F, applied to values, axes and thresholds together |
| Map | Live positions, trip history, geofences, downloadable offline regions |
| Sign-in | Email and password, with optional biometric unlock |
| Organisations | Multi-org accounts with switching and per-org device scoping |
| Updates | Over the air, with version and release number shown in the app |