Engineering · Workbench

Your CAN bus, your DBC, your firmware. In one workbench.

Decode CAN traces, edit DBCs, build Product JSON configs, look up DTCs, and ship firmware to FC-501 hardware. One workspace for OEM engineers and integrators — Local mode for offline work, Dev/Prod environment switching, and a full Swagger API.

Launch the Workbench See what's inside
DBC editor + 7 modes
Trace decoder & timeline
Full Swagger API · OAS 2.0
Local · Dev · Prod environments
340×
Faster signal mapping
Wayne AI auto-decode replaces months of manual J1939 / CAN reverse engineering.
6 mo hrs
DBC build time
From first connection to a production-ready DBC for a new vehicle line.
5+ → 1
Tools consolidated
Replaces Vector, Excel, Postman, Python scripts, and PDF DTC manuals.
30s
Trace to timeline
Drop a captured trace, decode against your DBC, plot any signal — instantly.
0
Bit-overlap bugs
Visual bit-layout view catches signal packing errors at design time, not in production firmware.

One workspace instead of five tabs and three license keys.

A typical OEM CAN engineer juggles 5–8 tools, half of them paid, none of them aware of each other. The Workbench collapses the entire toolchain into a single sign-on, cloud-synced workspace.

The old toolchain

  • Vector CANalyzer / PCAN-Explorer
  • Vector CANdb++ Editor
  • Microsoft Excel for signal trends
  • Postman / curl for API testing
  • Python scripts for file conversion
  • SAE J1939 reference manuals (PDF)
  • OEM-specific DTC PDFs & vendor portals
  • Hand-rolled Product JSON config tooling

The Workbench

iMatrix Telematics Engineer

Browser-based. Local-first workspaces sync to dev / prod. Workbench seats are bundled with your FC-501 OEM program — no separate procurement, no license server, no per-engineer renewal cycle.

Five tools, one workspace.

The Workbench groups every OEM engineering task in a single tabbed UI. Workspaces are local-first, sync to dev/prod when you're ready to ship.

Seven modes. One DBC source of truth.

Browse messages and signals, see the bit-level packing, edit the raw text, decode a captured trace, plot signal values over time, or convert between file formats. All from the same workspace.
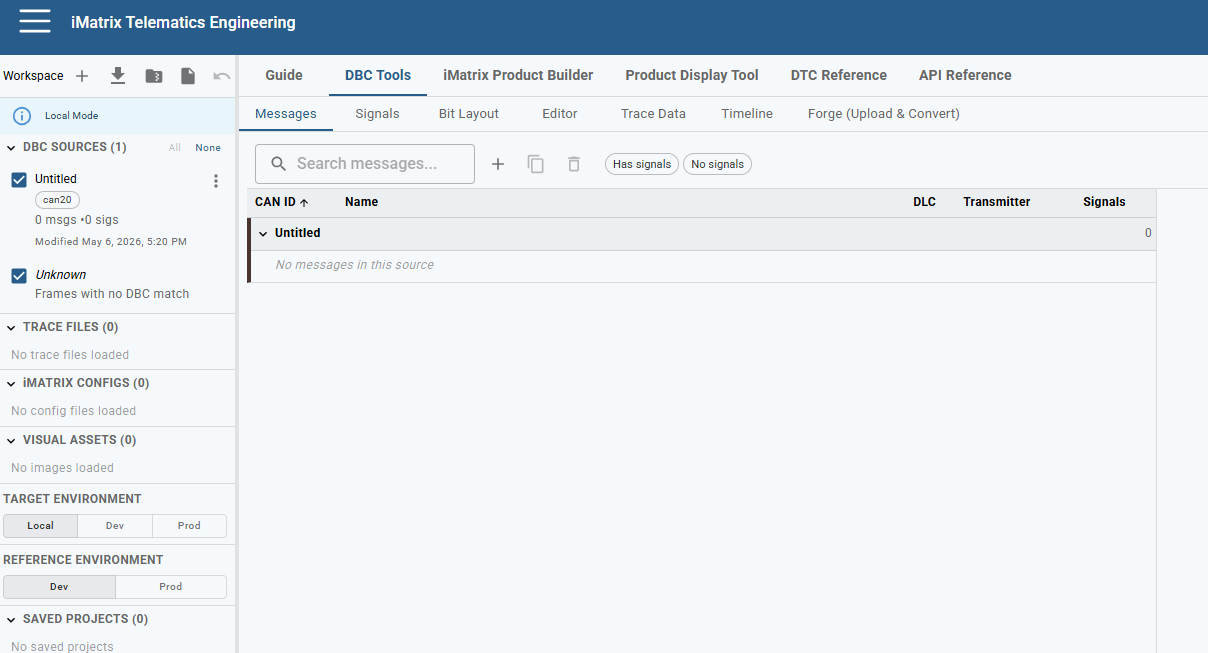
Tab 1

Messages

Browse and edit CAN messages. Filter by "has signals" / "no signals" to find unmapped IDs in your trace.

Tab 2

Signals

Inspect and edit signal definitions — bit start, length, byte order, scale, offset, unit, value tables.

Tab 3

Bit Layout

Visual bit-level signal packing diagram. Catches overlap and gaps before they become firmware bugs.

Tab 4

Editor

Raw DBC text with syntax awareness. For when you want to paste in a snippet from another tool or hand-tune.

Tab 5

Trace Data

Decode CAN bus recordings against your DBC. Drop in a `.trc` or `.asc` and see decoded signal values frame-by-frame.

Tab 6

Timeline

Plot signal values over time from any trace. Spot intermittent faults, validate calibration drift, debug race conditions.

Tab 7

Forge — Upload & Convert

File format conversions in-place. Upload, transform, download — without round-tripping through external tooling.

Compare

Diff Tab

Diff any two workspace files — spot what changed between DBC revisions or trace runs.

⏱ Without the Workbench

Stitching together five tools per signal

Capture in CANalyzer → import DBC in CANdb++ → decode → export CSV → trend in Excel → flip back to the editor when the bit layout looks wrong. Every signal investigation is its own context-switching marathon.

~30 min per signal · 6+ months for a new vehicle line
✓ With the Workbench

Everything in one workspace, in one tab

Drop the trace, click Timeline, the signal is plotted. Bit Layout catches packing bugs the moment you draw them. Wayne AI generates the first-pass DBC; you refine it inline. No license servers, no exports, no Excel.

Seconds per signal · Hours to a production DBC
cloud.imatrixsys.com/workbench → DBC Tools → Messages
iMatrix Workbench — DBC Tools, Messages tab

From DBC to deployed firmware in two tabs.

The Product Builder takes your validated DBC and generates a Product JSON — the device config that ships to FC-501 firmware. The Display Tool lets you preview and edit those configs before they hit production fleets.

cloud.imatrixsys.com/workbench → iMatrix Product Builder
Screenshot: iMatrix Product Builder tab Save as /assets/img/workbench-product-builder.png

Every diagnostic code, every manufacturer.

Built-in reference for OBD-II, J1939, and proprietary OEM DTC codes. Lookup by code, search by description, see frequency stats, or browse by manufacturer.

Sub-tab 1

Lookup

Enter a DTC code (P0420, B0001, C0035, U0100) — instantly see all manufacturer definitions.

Sub-tab 2

Search

Search by description — "catalyst efficiency", "throttle position" — find every matching DTC.

Sub-tab 3

Stats

Frequency stats across the database. Spot the most common DTCs your fleet hardware will see.

Sub-tab 4

Manufacturers

Browse OEM-specific DTC libraries. Manufacturer-defined codes that aren't in the public OBD-II spec.

⏱ Without the Workbench

Three sources per code, none of them current

Google the code → confirm against the SAE J1979 reference PDF → cross-check the OEM service manual → check internal Confluence for any prior incident notes. Repeat for every fault on every vehicle, every triage call.

~10 min per lookup · hundreds per fleet diagnostic cycle
✓ With the Workbench

One database, every manufacturer, instant lookup

Type the code, see every definition — public OBD-II, J1939, plus OEM-specific entries. Search by description ("catalyst efficiency"). Sort by frequency to know which DTCs your fleet will see most. Manufacturer browser surfaces codes that aren't in any public spec.

< 1 second per lookup · entire database always current
cloud.imatrixsys.com/workbench → DTC Reference → Lookup
iMatrix Workbench — DTC Reference, Lookup tab

Full Swagger / OpenAPI 2.0 spec.

Every iMatrix Cloud endpoint is documented inline. Base URL /api/v1. HTTPS only. Try-it-out is live against the dev environment.

Auth
Organizations
DTC
Products
Platforms
Things
Users
Sensors
Groups
Files
Acl
Logs
cloud.imatrixsys.com/workbench → API Reference
iMatrix Workbench — API Reference (Swagger UI)

Three debugging stories you've probably lived.

The Workbench's real value isn't a feature checklist — it's the moments when something's wrong on a customer's truck and you need an answer in minutes, not days. Each of these is a real OEM debug pattern.

"The fuel gauge reads zero on every truck after firmware v3.2"

Field service is calling. Three OEM customers, dozens of trucks, fuel-level signal returning 0 since the last OTA. You have 30 minutes before sales escalates.
Open Workbench → Trace Data: drop a captured trace from one of the affected trucks. Bit Layout: the fuel-level signal's start bit shifted by 4 in v3.2's DBC because someone added a flag byte upstream. Compare tab: diff v3.1 vs v3.2 DBC, exact change visible. Hotfix the DBC, regenerate Product JSON, push OTA.
Old way: 2–3 days · Workbench: ~25 min

"Customer says battery SoC is drifting. Is it real?"

A fleet customer thinks their EV battery state-of-charge readings drift across a workday. Could be a real battery issue, could be a calibration bug, could be a CAN signal scaling mistake. You have a captured trace, no obvious answer.
Open Workbench → Timeline: overlay SoC, pack voltage, current, and ambient temperature on one chart. 30 seconds in, the SoC line shows step changes synchronized with charging events — calibration is fine, the customer's seeing normal behavior. Send them the screenshot.
Old way: 45 min Excel work · Workbench: 30 sec

"What does U010F mean on a Volvo D13?"

A specific manufacturer's DTC code shows up in a customer's fleet report. The public OBD-II spec doesn't list it. Engineering needs an answer before the QBR meeting in 20 minutes.
Open Workbench → DTC Reference → Manufacturers: filter by manufacturer, type the code. Workbench surfaces the OEM-specific definition — "Lost Communication With Engine Control Module B" — plus frequency stats showing how often this DTC appears across iMatrix fleets, plus the typical resolution path. Done before you finished pouring coffee.
Old way: ~10 min Googling + manuals · Workbench: < 30 sec

From Wayne AI to FC-501 firmware — three steps, one quarter.

The Workbench is the middle layer. Wayne AI auto-maps your bus and produces a draft DBC in hours. The Workbench is where engineers refine, validate against captured traces, plot signal behavior, and generate Product JSON in days. FC-501 OTA pushes the config to deployed vehicles in minutes. End-to-end: order to first vehicle in production inside one quarter.

1. Wayne AI

Auto-maps your J1939 / CAN bus from a 5-min trace. Outputs a draft DBC + signal database — 340× faster than manual reverse engineering.

2. Workbench

Engineers refine signals, decode validation traces, plot timelines, generate Product JSON. Everything in one workspace, local mode for offline work.

3. FC-501 Fleet

Workbench pushes the Product JSON to FC-501 OTA. Deployed vehicles pick up the new config on next handshake. Validate before promoting Dev → Prod.

Environment Switch
LocalOffline workspace
DevStaging fleet
ProdLive deployment

Drop it in. The Workbench handles the rest.

Drag any of the formats below onto the workspace sidebar. Standard CAN tooling files plus iMatrix-native formats.

.dbcCAN Database
.trcVector Trace
.ascASCII Trace
.csvDecoded data
.jsonProduct JSON
.binFirmware
.imxiMatrix Config

The Workbench sits at the center of the platform.

Three other parts of iMatrix talk to the Workbench directly. Dive into any of them to see the bigger picture.

Open the Workbench. See your bus decoded.

Free for all iMatrix Cloud accounts. Sign in, open Telematics Engineer from the app menu, and drop in a DBC or a trace to start.

https://cloud.imatrixsys.com → Telematics Engineer